Interactive Geopolitics Map & Diplomacy Map
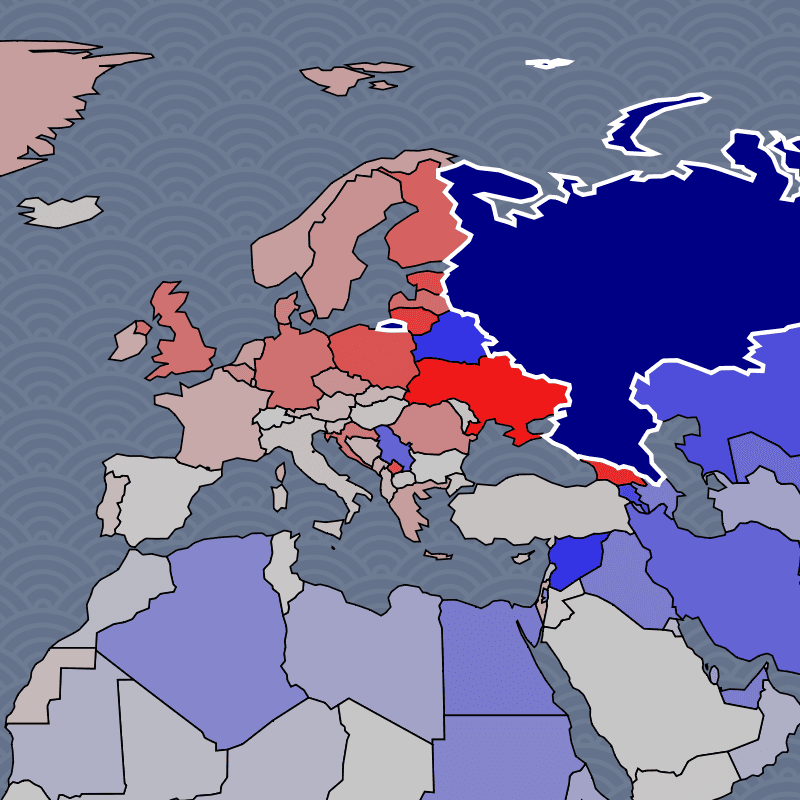
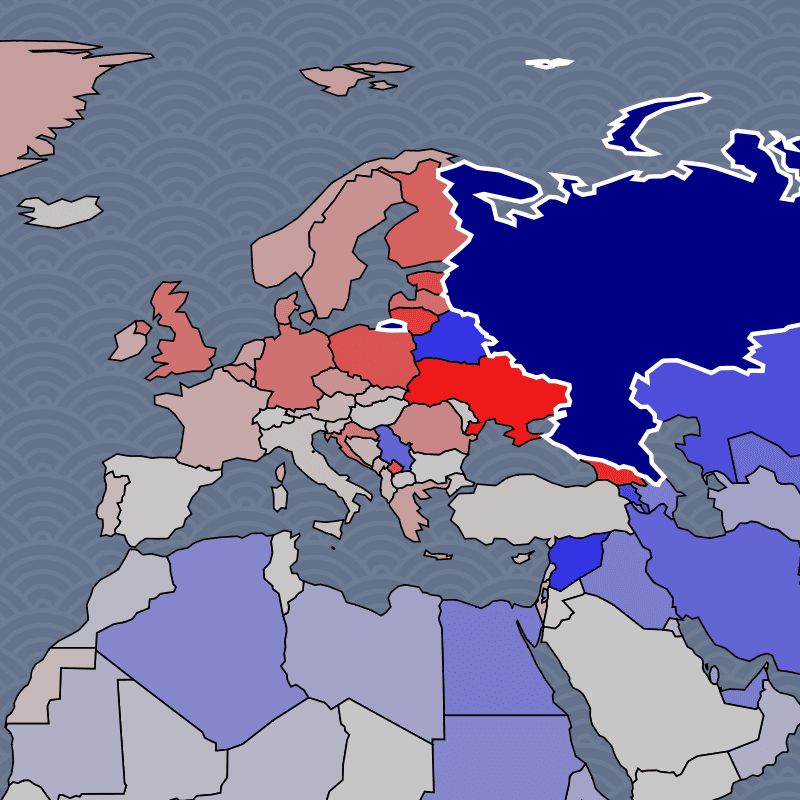
This interactive geopolitics map lets you explore diplomatic relationships between countries worldwide. Simply click on any nation to see its international relations visualized through color-coded connections. Countries with strong ties appear in blue, while those with tensions show in red. You can navigate the diplomacy map by selecting different countries to compare how their diplomatic networks and alliances differ.
Understanding Diplomatic Relationship Scores on the Geopolitics Map
The color intensity represents the strength of the relationship. Clicking any country will highlight its network of relationships.
- Friendly (Blue)
- Neutral (Gray)
- Unfriendly (Red)

Navigating the Diplomacy Map
Click on any country to see its web of international relationships unfold on this diplomacy map. You can compare how different nations relate to the world by selecting various countries, which helps reveal how geography and politics shape global geopolitical connections.
How This Works
This map is created by querying GPT-5 for all country pairs (20,000 pairs in total). GPT-5 is asked to summarize the relationships between the two countries, then conclude with a numeric score that represents the relationship. I do this five times, extract the scores, and average the results to produce the final relationship score you see visualized on the map.
The underlying dataset is generated on August 18, 2025. GPT-5's knowledge cutoff is September 30, 2024, significant events occurring after that date, such as Trump's election or Syria's regime change, are included by providing GPT-5 with the relevant information. Although I make every effort to stay on top of relevant events, some events may have been omitted. Future versions will take a more systematic approach to handling this.
